How we at Enovation designed a software solution for data integration and visualization
Data is an important part of any business. Based on data, you can evaluate your business and marketing activities, create marketing strategies or business plans. In order to make important decisions based on data, it is important to have data linked and visualized clearly in one place.
Enovation, the largest domestic grant consulting company, faced the challenge of connecting and optimizing business, marketing and advertising data. They faced limitations when visualizing through their existing PowerBI software, which was run by a third-party former advertising agency.
This situation is not uncommon; it is often the case that agencies own the license for the entire software and provide their clients with access to the tool so that the client does not have to acquire the expensive license at their own expense. However, once the collaboration ends, access to an individual account tends to be costly. For Enovation, this meant limited access to data with read-only rights without the ability to make changes.
Linking marketing and business data in Keboola
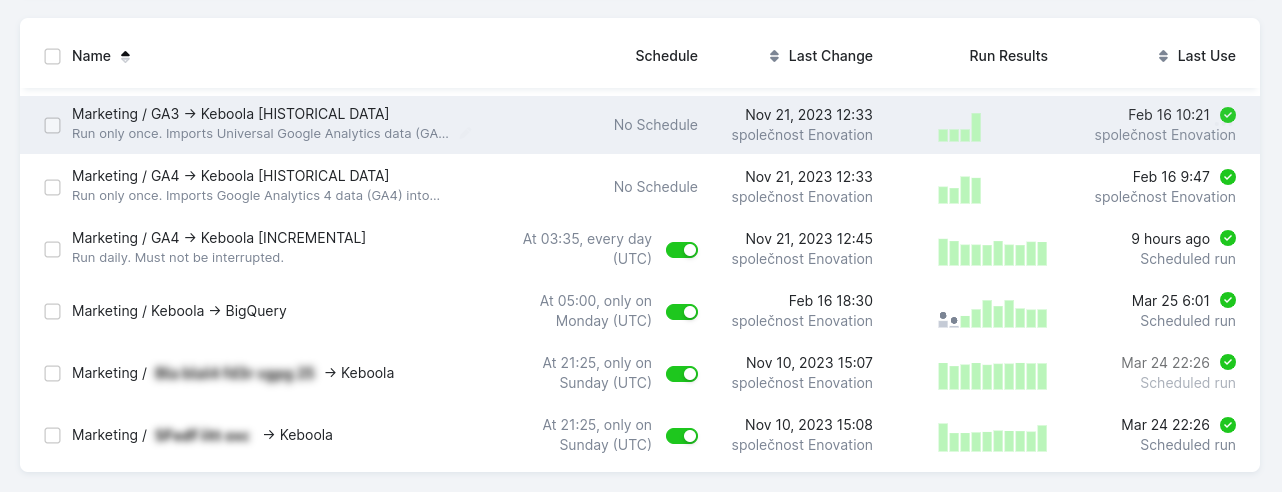
We came up with a solution that removed the data access restrictions and gave Enovation full control over their data strategy. At Enovation, we introduced the Keboola software solution for data integration and linking. By setting up their own Keboola account, Enovation not only gained freedom in data manipulation, but also an effective tool for process optimization. In addition, we consulted the deployment of the new software directly with Keboola representatives in a scheduled session so that we were 100% sure of the functionality of the proposed solution.
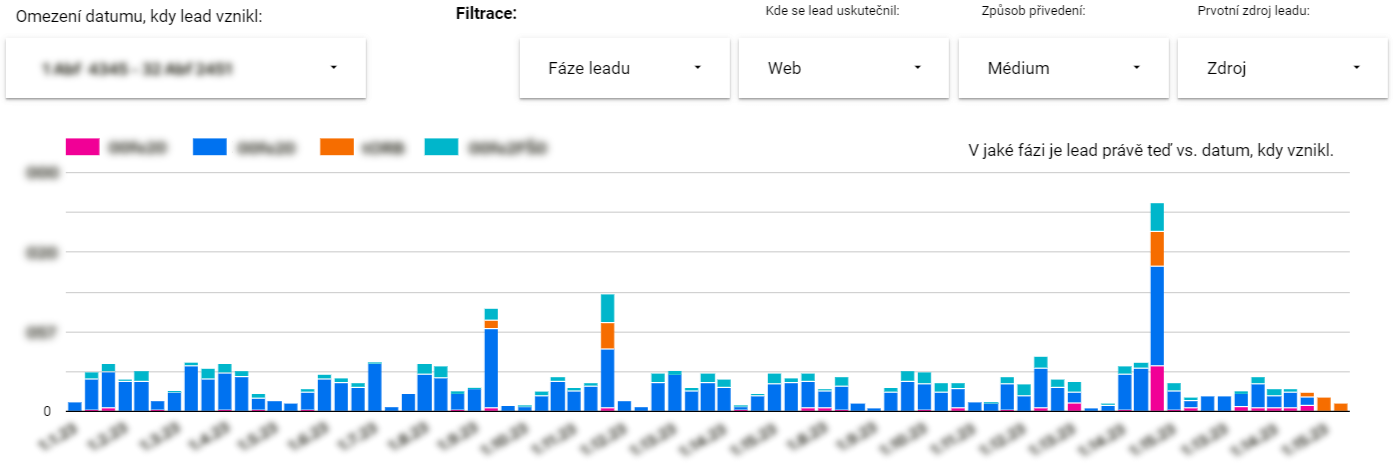
Visualization of the results in Looker Studio
The transition to the new software was not just about deploying Keboola. Following an agreement with Enovation, we replaced PowerBI with Looker Studio, which not only offers excellent data visualisation but also better integration options with Keboola. To ensure a seamless data flow, we also integrated Google BigQuery into the process. This data repository allows large volumes of data to be stored for free, but with the requirement of regular updates, as data cannot "sit" in the repository indefinitely. For our needs, the free version is fully sufficient, as all data is updated regularly in the case of this project and there is no risk of losing it.
With the comprehensive solution of integrating the data in Keboola and then visualizing it in Looker Studio, Enovation can fully focus on its business goals and strategies. Connecting all systems and data sources has allowed Enovation to not only gain a better understanding of its results and client behavior, but also to better plan and optimize future strategies by having a holistic view of all data in one place.
Thanks to the flexibility and efficiency of Keboola and Looker Studio software, which enable data integration and visualization in one place, Enovation is now able to use the data they collect more effectively and achieve better results in their industry.
Want a customized software solution?
Related articles
On Tuesday 21 April, Prague’s Výstaviště exhibition centre in Holešovice was transformed into a hub of technological innovation. This was the...
COLORIT is one of the long-established players on the Czech B2B and B2C market for paints, varnishes and sealants. Its position has not been...
Libeřské lahůdky offers its delicacies in 21 shops not only in Prague, but also in České Budějovice, for example, and new branches are regularly...